Breaking Down PUE: The Number That Tells You How Much Power Your Data Center Wastes
Your CFO wants to know why the power bill is so high. Your facilities team says the servers are running fine. Your CTO is asking about efficiency benchmarks. Everyone's talking past each other because they're all missing the same fundamental truth: most data centers waste between 35% and 80% of the electricity they consume, and there's one number that tells you exactly how much.
That number is PUE, or Power Usage Effectiveness. It's the most important metric in our industry, and it's also the most misunderstood. We've been tracking PUE across thousands of facilities, and the gap between best practice and common practice is staggering. More importantly, the gap represents millions of dollars in unnecessary operating costs and dozens of megawatts of wasted capacity.
Here's what PUE actually measures, where your power really goes, and why the difference between a PUE of 1.8 and 1.2 could be the most expensive efficiency lesson you never learned.
The PUE Formula: Simple Math, Complex Reality
Power Usage Effectiveness is deceptively simple: Total Facility Power divided by IT Equipment Load. A perfect PUE of 1.0 would mean every watt you draw from the utility goes directly to servers, storage, and networking equipment. That's impossible in the real world, but it's the theoretical ideal.
1.0 Perfect PUE (Impossible)In practice, PUE tells you how much overhead power your facility consumes for every watt of actual computing. A PUE of 1.5 means for every 100 watts your servers need, you're paying for 150 watts from the utility. That extra 50 watts goes to cooling, power conversion losses, lighting, and all the infrastructure required to keep those servers running.
The industry average sits between 1.56 and 1.58 according to the latest Uptime Institute data. That means the typical data center wastes 36% to 37% of its electricity on overhead. But averages hide the real story. We've measured facilities running everything from PUE 1.09 in hyperscale environments to PUE 2.1 in legacy enterprise facilities that haven't been upgraded since 2008.
Let's break down exactly where that power goes in a real 100MW facility.
Where Your 100 Megawatts Actually Go
Walk through the power distribution in a typical modern facility with a PUE of 1.54. You're paying for 100MW from the utility, but only 65MW reaches your IT equipment. The other 35MW disappears into overhead before it ever touches a server.
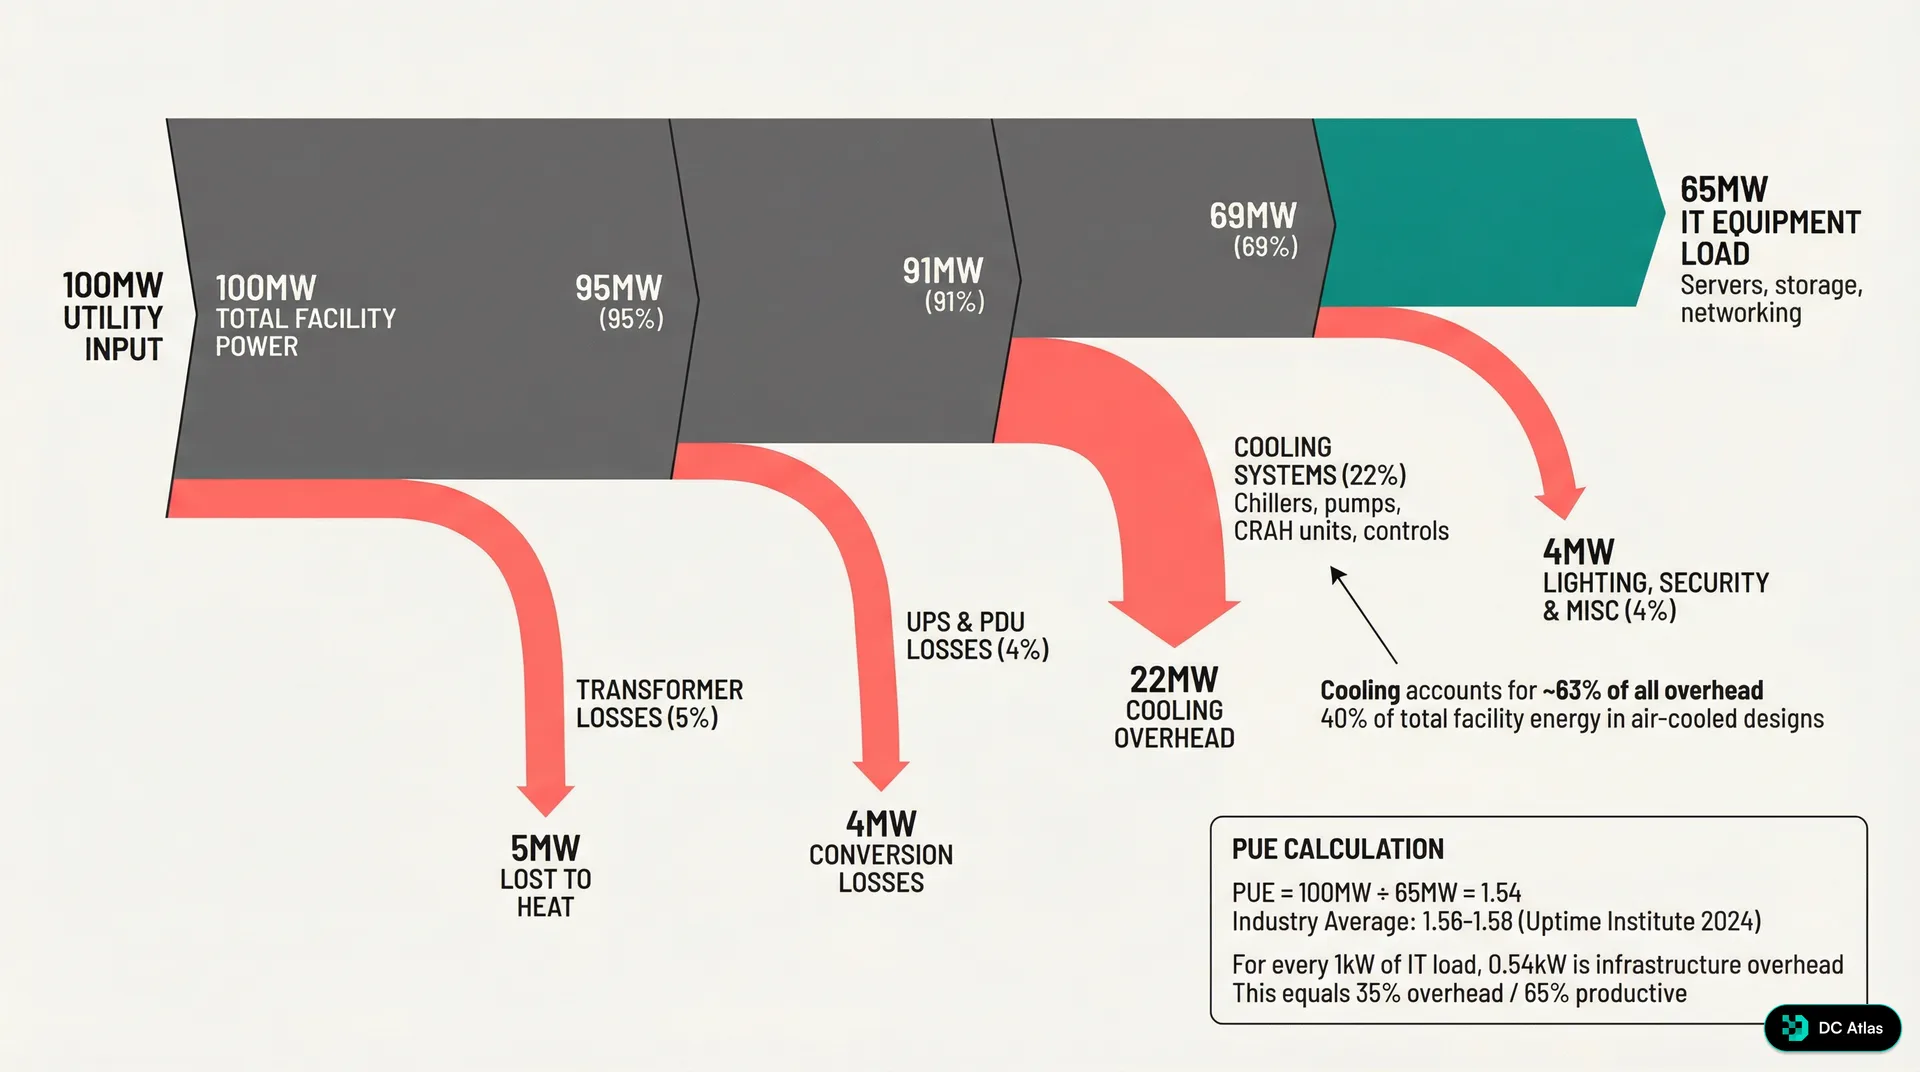
The biggest chunk of that overhead goes to cooling: 22MW, or 63% of all non IT power consumption. This isn't surprising when you consider that every watt of heat your servers produce has to be removed from the facility, and the cooling equipment itself generates additional heat that also needs to be managed.
Transformer losses account for another 5MW. These are unavoidable physics, the price of stepping down utility power from medium voltage to the levels your equipment can use. Similarly, UPS systems and power distribution units consume 4MW in conversion losses, the cost of providing clean, conditioned power and protecting against outages.
The remaining 4MW goes to lighting, security systems, fire suppression, building management systems, and all the ancillary equipment that keeps a data center operational. This category is often overlooked but represents meaningful overhead in large facilities.
The 65% Reality Check
In a typical facility, only 65% of your power bill actually powers compute workloads. The rest is overhead tax on doing business in the physical world.
The Efficiency Spectrum: Legacy to Hyperscale
Not all data centers are created equal. The gap between poorly optimized legacy facilities and hyperscale operations is massive, both in energy consumption and operating costs.
Legacy air cooled facilities, particularly those built before 2012, commonly operate at PUE 1.8 or worse. For our 100MW IT load example, that means 180MW of total facility power. You're wasting 80MW on overhead, a 44% efficiency penalty that translates directly to your power bill every month.
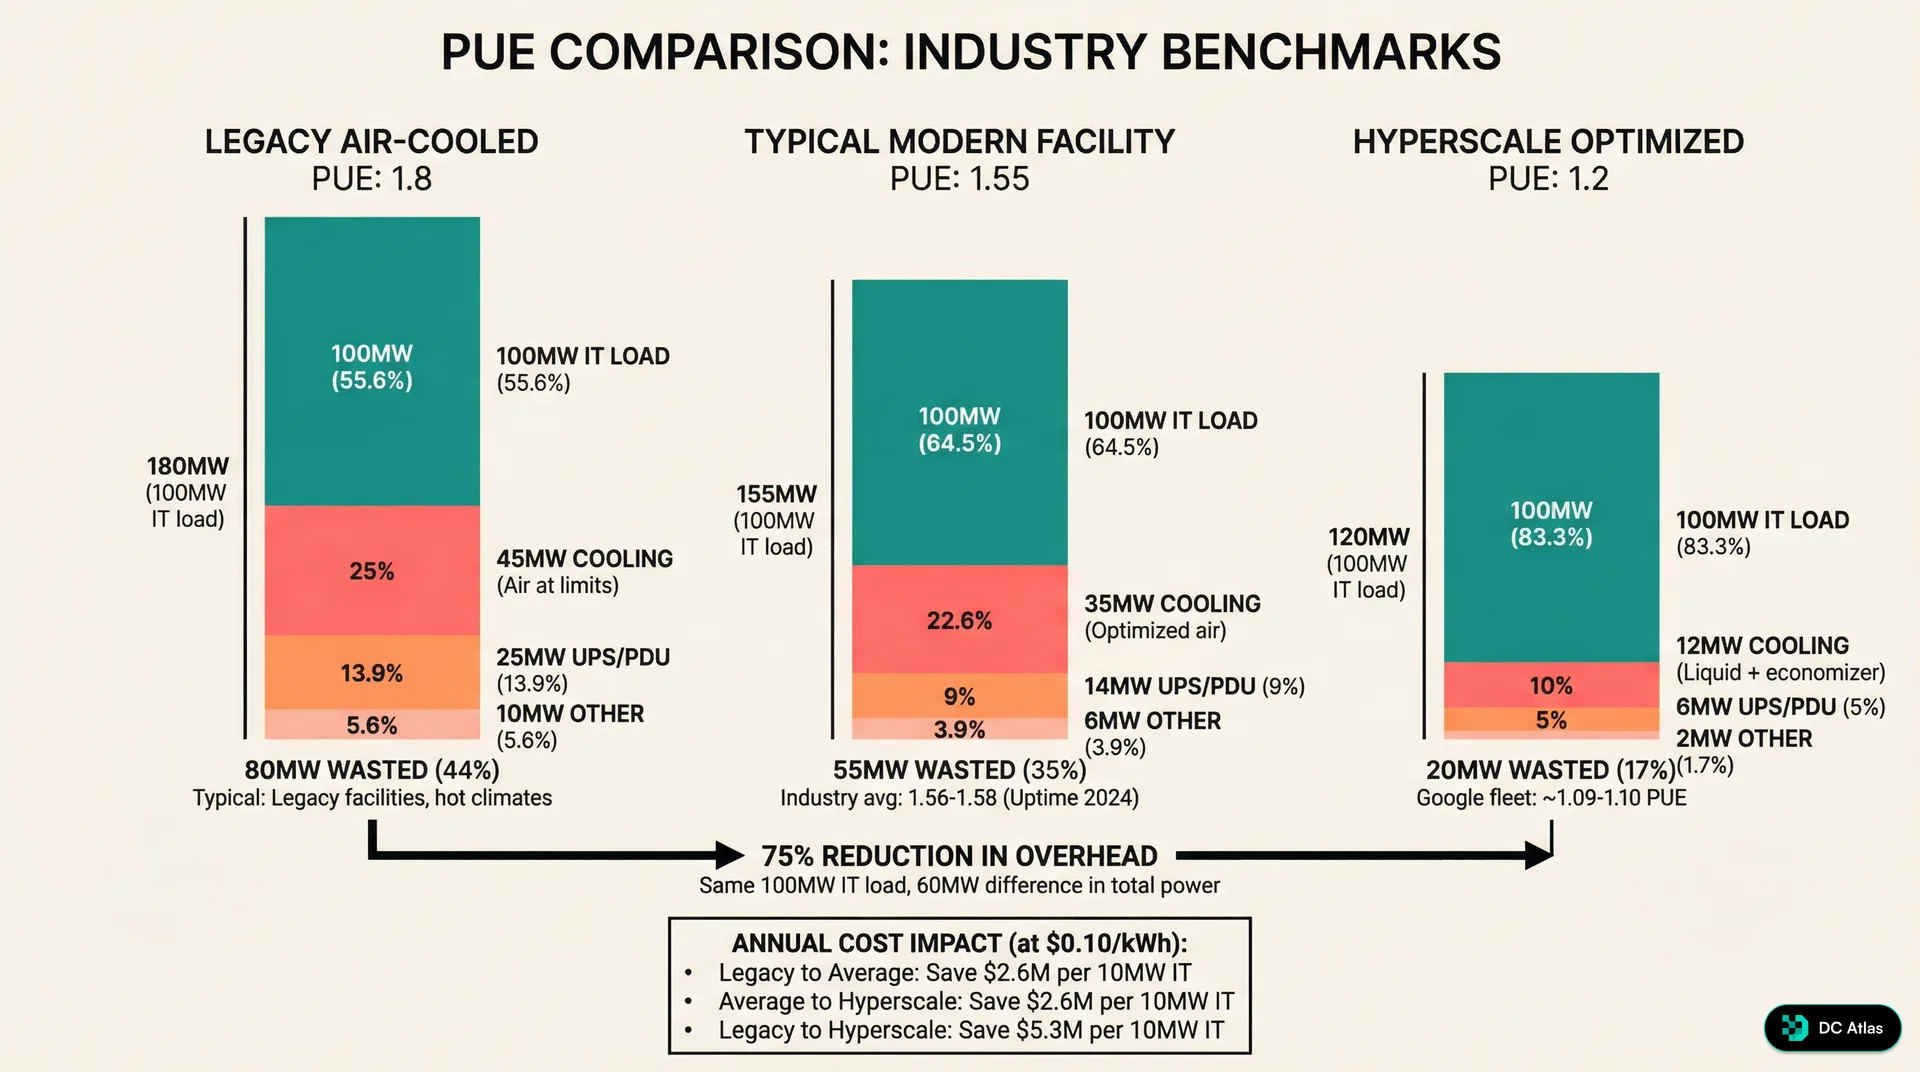
Modern facilities, those built in the last five years with current best practices, typically achieve PUE between 1.5 and 1.6. That brings overhead down to 55MW for the same 100MW IT load, a 31% reduction compared to legacy facilities. This improvement comes primarily from more efficient cooling systems, better power distribution design, and improved management of ancillary loads.
But the real performance leaders operate in hyperscale optimized environments. Google's fleet, for example, maintains an annual average PUE between 1.09 and 1.10. At PUE 1.2, that same 100MW IT load requires only 120MW total facility power, wasting just 20MW on overhead. Going from legacy efficiency to hyperscale efficiency represents a 75% reduction in overhead power consumption.
75% Overhead Reduction: Legacy to HyperscaleThe financial impact is staggering. At typical utility rates of 10 cents per kWh, moving from legacy to average efficiency saves 2.2 million dollars annually per 10MW of IT load. Moving from average to hyperscale saves another 3.1 million dollars. The total improvement from legacy to hyperscale represents 5.3 million dollars in annual savings for every 10MW of IT capacity.
Cooling: The Efficiency Battleground
Cooling dominates PUE because it's both the largest overhead consumer and the most variable. In our 100MW facility example, cooling accounts for 22MW of the 35MW overhead load. More importantly, cooling overhead scales with both IT load and ambient conditions, making it the primary driver of seasonal PUE variation.
Traditional air cooling systems are hitting physical limits. The combination of CRAC units, air handlers, and facility distribution fans typically consumes 3.5MW for every 10MW of IT load. That's a 35% overhead penalty just for cooling, before you account for any other facility systems.
Air cooling also creates density constraints that force PUE degradation. Most air cooled facilities hit their ceiling at 25 to 30kW per rack. Above that threshold, cooling overhead increases exponentially due to fan power requirements and hot spot management. We've measured facilities attempting higher air cooled densities where cooling overhead jumps to 50% or more of IT load, often accompanied by noise levels exceeding 80 decibels.
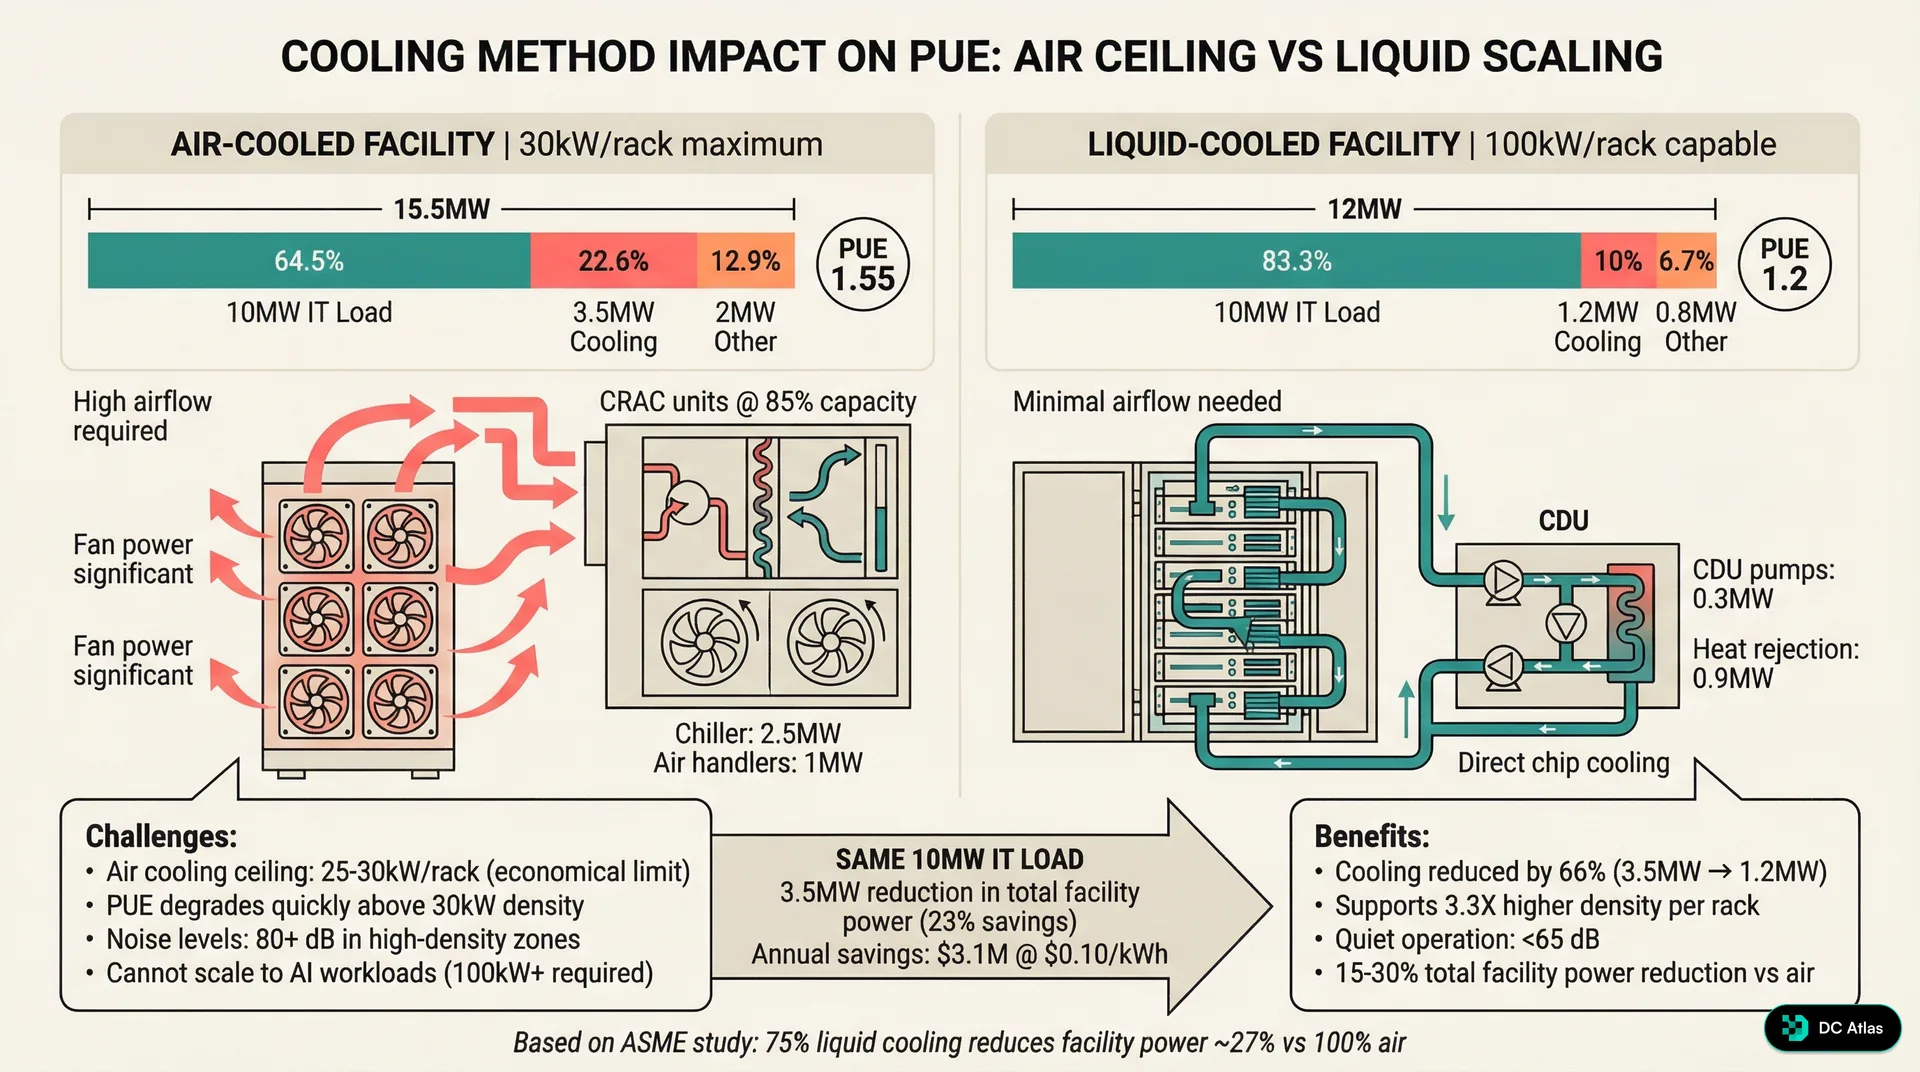
Liquid cooling changes the equation fundamentally. Direct chip cooling or immersion cooling systems typically consume only 1.2MW per 10MW of IT load, a 66% reduction in cooling overhead. This reduction comes from eliminating facility air movement, reducing heat exchanger temperature deltas, and removing the need to maintain specific humidity levels throughout the facility.
The density advantage is equally important. Liquid cooling enables rack densities of 100kW or more while maintaining quiet operation under 65 decibels. This 3.3x density improvement means you can deploy the same IT capacity in significantly less floor space, reducing facility capital costs and improving space utilization.
Recent ASME studies confirm that facilities with 75% liquid cooling and 25% air cooling see approximately 27% reduction in total facility power consumption compared to 100% air cooled designs. The efficiency gains compound because liquid cooling also enables more aggressive use of economizer and free cooling systems.
The Density-Efficiency Connection
Liquid cooling isn't just about PUE. Higher density reduces facility footprint, construction costs, and total cost of ownership while improving efficiency. It's the rare technology that delivers multiple benefits simultaneously.
Climate and Seasonal Reality
PUE varies significantly with outside temperature, and the variation pattern tells you everything about your cooling system design. Conventional air cooled facilities show dramatic seasonal swings, while optimized liquid cooled systems maintain consistent efficiency year round.
In a typical climate like Northern Virginia, conventional air cooled facilities fluctuate from PUE 1.4 in winter to PUE 1.85 during summer peak conditions. That's a 0.45 point swing driven primarily by cooling load and the availability of free cooling. During winter months, outside air can provide 60% to 80% of cooling capacity through economizer systems. Summer operation requires full mechanical cooling with much higher power consumption.
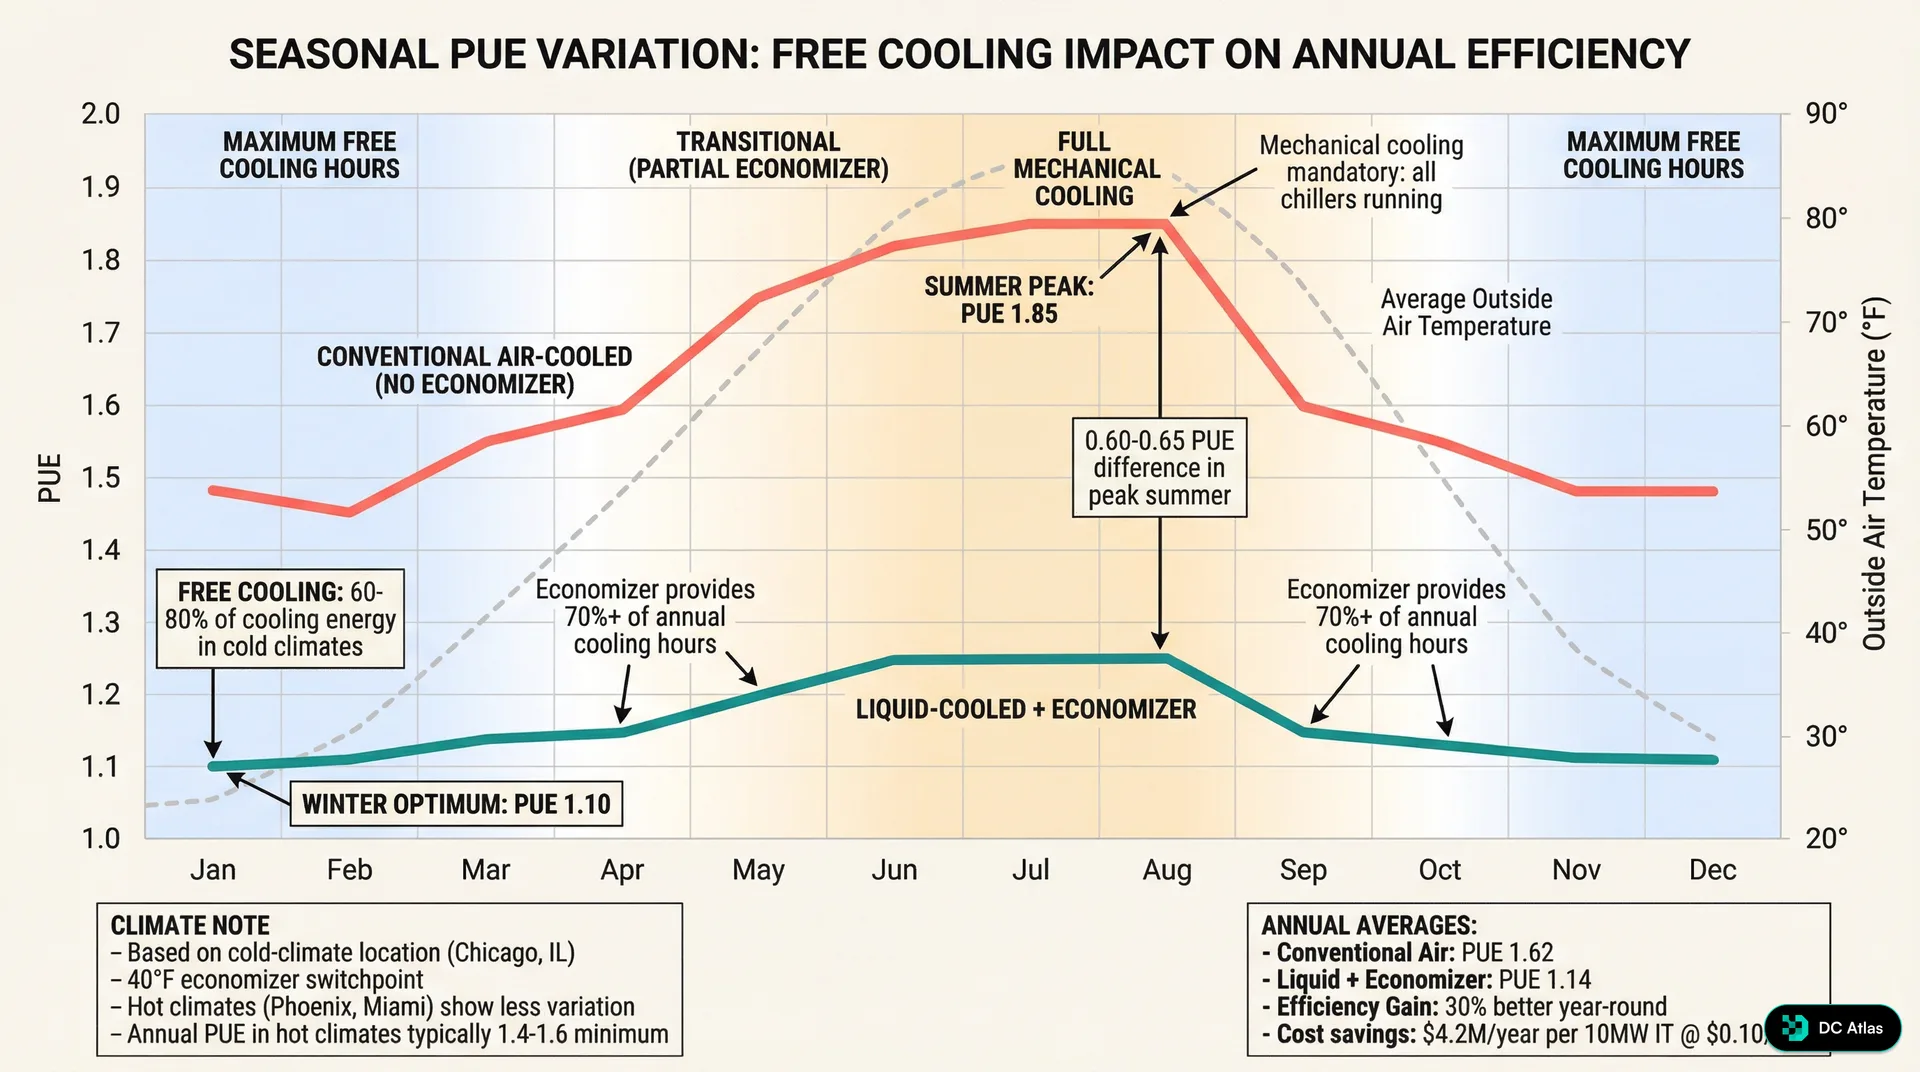
Liquid cooling with economizer integration maintains PUE between 1.10 and 1.25 throughout the year, showing only a 0.15 point variation. This consistency comes from higher cooling system efficiency and better integration with outside air systems. Liquid cooled systems can take advantage of free cooling opportunities for approximately 70% of annual operating hours in moderate climates.
Geographic location becomes critical for PUE optimization. Cold climate locations like Chicago benefit dramatically from free cooling, with conventional facilities seeing winter PUE as low as 1.3 and liquid systems approaching 1.05. Hot climate locations like Phoenix or Miami show less seasonal variation but typically maintain higher baseline PUE, often 1.4 to 1.6 minimum even with optimized systems.
Annual average PUE tells the complete story. Conventional air cooled facilities typically average PUE 1.62 when accounting for full year operation. Liquid cooling with economizer integration averages PUE 1.14, representing 30% better efficiency year round.
30% Annual Efficiency Advantage: Liquid vs Air CoolingThe Hidden PUE Traps
PUE measurement seems straightforward, but several factors can distort the numbers and hide real inefficiencies. Understanding these traps is critical for accurate benchmarking and meaningful facility comparisons.
Partial load operation significantly impacts PUE. Most cooling systems are designed for full capacity operation and become less efficient at partial loads. A facility designed for 50MW but currently operating at 30MW will show worse PUE than the same facility at full capacity. This creates a timing challenge for new facilities that are still filling up with IT equipment.
IT equipment utilization also affects PUE calculations. Servers drawing power but running at low utilization still generate heat that must be removed, but the denominator in the PUE calculation includes their full power draw. A facility full of idle servers will show better PUE than a facility running compute intensive workloads at the same total power level.
Measurement boundaries matter enormously. Some operators exclude certain facility systems from PUE calculations, making their numbers look better but reducing comparability. Network equipment in meet me rooms, tenant improvements, and shared infrastructure can be classified differently depending on facility ownership structure and lease arrangements.
Temporal measurement frequency creates another variable. PUE calculated from monthly utility bills will differ from PUE measured continuously with facility monitoring systems. Seasonal variations mean that annual average PUE provides the most meaningful comparison, but quarterly or monthly snapshots can be misleading depending on when they're taken.
PUE Gaming Alert
Be skeptical of PUE numbers that seem too good to be true. Measurement methodology, boundary definitions, and load conditions can all be manipulated to improve reported efficiency without changing actual performance.
Practical PUE Improvement Strategies
Improving PUE requires systematic evaluation of all facility overhead loads, but cooling typically offers the largest improvement opportunities. Start with cooling system optimization before investing in more complex infrastructure changes.
Airflow management provides immediate PUE benefits in air cooled facilities. Proper hot aisle and cold aisle containment can reduce cooling overhead by 15% to 25% with minimal capital investment. Sealing cable openings, installing blanking panels, and optimizing pressure differentials often delivers PUE improvements of 0.1 to 0.2 points.
Variable frequency drives on cooling equipment provide dynamic efficiency optimization. Most cooling systems operate at fixed speeds regardless of actual cooling demand, wasting significant energy during partial load or favorable weather conditions. VFD retrofits typically pay for themselves within 18 months through energy savings.
Temperature and humidity setpoint optimization represents low hanging fruit for many facilities. Raising cold aisle temperatures from 68°F to 75°F can reduce cooling energy consumption by 20% to 30% without impacting IT equipment reliability. Similarly, expanding humidity bands from ±5% to ±15% relative humidity reduces dehumidification and humidification energy.
Power distribution efficiency improvements focus on reducing transformer and UPS losses. Right sizing transformers for actual loads rather than worst case scenarios can improve efficiency by 2% to 4%. Similarly, operating UPS systems in eco mode or high efficiency mode when appropriate reduces conversion losses.
Economizer and free cooling integration provides the largest efficiency gains in appropriate climates. Direct outside air economizer systems can provide 100% of cooling capacity when outside temperatures drop below 55°F. Water side economizer systems extend free cooling opportunities to higher ambient temperatures by using cooling towers or dry coolers.
LED lighting conversions and lighting controls reduce facility overhead loads while improving working conditions. Occupancy sensors, daylight harvesting, and task specific lighting design can cut lighting energy consumption by 60% to 80% compared to traditional fluorescent systems.
The Business Case for PUE Optimization
PUE improvement directly translates to operating cost reduction, but the business benefits extend beyond immediate energy savings. Lower PUE enables higher IT density, extends facility capacity, and improves competitiveness in power constrained markets.
Energy cost savings scale linearly with facility size. For a 10MW facility improving from PUE 1.8 to PUE 1.3, annual savings exceed 4.4 million dollars at 10 cents per kWh. These savings compound annually and provide immediate cash flow improvement without reducing IT capacity or performance.
Capacity extension provides additional business value. Improving PUE from 1.8 to 1.3 effectively increases available IT capacity by 28% within the same utility connection and facility infrastructure. For capacity constrained facilities, this represents millions of dollars in avoided capital expenditure and faster time to market for new deployments.
Competitive positioning becomes increasingly important as efficiency requirements tighten. Corporate sustainability mandates, renewable energy commitments, and regulatory requirements all favor more efficient operations. Facilities with poor PUE face increasing business development challenges as customers prioritize efficiency in vendor selection processes.
Operational resilience improves with better PUE through system redundancy and reduced stress on infrastructure components. More efficient cooling systems typically include more sophisticated controls, better monitoring, and improved fault tolerance. Lower total power consumption also reduces stress on electrical infrastructure and backup power systems.
$4.4M Annual Savings: 10MW Facility PUE 1.8 to 1.3The Future of PUE and Beyond
PUE remains the industry standard efficiency metric, but its limitations are becoming more apparent as data center operations evolve. Several trends are pushing the industry toward more comprehensive efficiency measurements and operational optimization strategies.
Liquid cooling adoption is accelerating PUE improvements across the industry. We're tracking rapid deployment of direct chip cooling, immersion cooling, and hybrid cooling systems that were considered experimental just five years ago. These systems consistently deliver PUE below 1.25 while enabling density levels that were impossible with air cooling.
AI and machine learning workloads are creating new efficiency challenges and opportunities. AI training workloads generate more heat per server but often run at consistent utilization levels that enable more predictable cooling optimization. Inference workloads show different power patterns that may benefit from different cooling approaches.
Edge computing is driving efficiency requirements in smaller facilities where traditional economies of scale don't apply. Edge sites with 1MW or less IT capacity struggle to achieve good PUE due to fixed facility overhead loads. This is pushing innovation in modular, pre fabricated systems and micro data center designs.
Carbon intensity metrics are supplementing PUE as sustainability becomes a primary concern. Carbon Usage Effectiveness (CUE) multiplies PUE by grid carbon intensity to provide a more complete environmental impact measure. Water Usage Effectiveness (WUE) tracks water consumption, particularly important for cooling tower and evaporative cooling systems.
Real time optimization using artificial intelligence is enabling dynamic PUE management that adjusts cooling, power, and IT workload placement continuously. These systems can maintain optimal efficiency automatically while responding to changing conditions faster than human operators.
Beyond PUE
While PUE remains essential, the industry is moving toward holistic efficiency metrics that include carbon intensity, water usage, and total cost of ownership. The most efficient facilities optimize across all these dimensions simultaneously.
Your PUE Action Plan
Understanding PUE is the first step, but improving it requires systematic measurement, analysis, and optimization. Start with accurate baseline measurement, identify the largest improvement opportunities, and implement changes in order of financial return.
Implement comprehensive monitoring that measures facility power and IT power continuously, not just monthly utility bills. Install sub metering for major facility systems including cooling, UPS, lighting, and ancillary loads. This data is essential for identifying improvement opportunities and tracking progress over time.
Benchmark your current performance against industry standards and similar facilities. A PUE above 1.6 indicates significant improvement opportunities. A PUE below 1.3 suggests your facility is already well optimized, but opportunities may still exist in specific systems.
Focus on cooling optimization first, since it typically represents the largest efficiency opportunity. Evaluate airflow management, temperature setpoints, equipment efficiency, and economizer integration. These improvements often provide the fastest payback periods and largest PUE reductions.
Consider liquid cooling for high density deployments or facility retrofits. While capital costs are higher, the combination of PUE improvement, density increase, and operational benefits often justify the investment for facilities above 5MW IT capacity.
Plan for continuous optimization rather than one time improvements. PUE optimization is an ongoing process that requires regular monitoring, adjustment, and system updates. The most efficient facilities treat PUE management as a core operational discipline, not a one time project.
The gap between efficient and inefficient data centers continues to widen as best practices evolve and new technologies mature. Facilities that fail to optimize PUE face increasing competitive disadvantages in energy costs, capacity utilization, and customer attraction. Those that master PUE optimization gain sustainable operational advantages that compound over time.
PUE tells you exactly how much power your data center wastes. What you do with that information determines whether you're paying for compute capacity or just heating the outside air.
Join the waitlist to access premium features
Get access to 7,000+ data center facilities, AI-powered search, and market intelligence.
Join Waitlist